Key Features
-
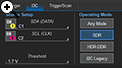
Supports triggers in SDR, HDR-DDR, and Legacy I2C operating modes
-
Provides triggering in “ANY” supported operating mode
-
Provides for complex triggering with defined Address, R/W (direction), Common Command Code, and Data.
-
Conditional data definition (<, <=, =, >, >=, <>, INRANGE, OUT of RANGE).
-
Use analog or digital (MSO) inputs for acquisition and triggering.
-
Automated timing and bus measurements
-
Extract digital sensor data and plot it as a waveform
-
Eye diagrams of I3C signals
Comprehensive and Powerful I3C Trigger ("T")
Capability is provided to permit triggering on any MIPI-defined allowable command sequence, and also on user-defined command sequences, with full capability to define specific data values or ranges of data values.
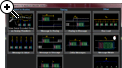
Conditional DATA Trigger Setup ("T")
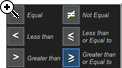
The trigger permits a conditional (<. <=, =, >, >=, <>, inside a range, outside a range) setup for the DATA condition. This is especially useful in situations where abnormal events should be monitored, such as when a CAN node broadcasts a low or high engine RPM or coolant pressure.
Intuitive, color-coded Decode Overlays ("D")
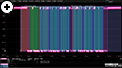
A transparent overlay with color-coding for specific portions of each protocol and the entire message frame makes it easy to understand your serial data information. Unlike other solutions, with protocol decode information away from the signal, our solution correlates the waveform and the protocol decode directly on the display. As the acquisition length is expanded or shortened, the decode overlay will adjust to show you just the right amount of information.
Interactive Table Summarizes Results ("D")
Turn the oscilloscope into a protocol analyzer with a tabular display of decoded information. Customize the table to show only the data of interest and touch a message in the table to automatically zoom to it and display it on the screen. Export the table for offline analysis. Up to four different decoded signals of any type may be simultaneously displayed in the table.
Measure/Graph Tools for Validation Efficiency ("M")
Quickly validate cause and effect with automated timing measurements to or from an analog signal or another serial message. Make multiple measurements in a single long acquisition to quickly acquire statistics during corner-case testing. Serial (digital) data can be extracted to an analog value and graphed to monitor system performance over time, as if it was probed directly. Complete validation faster and gain better insight.
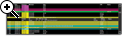
Eye Diagrams ("E")
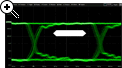
Rapidly display an eye diagram of your packetized low-speed serial data signal without additional setup time. Use eye parameters to quantify system performance and apply a standard or custom mask to identify anomalies. Mask failures can be indicated and can force the scope into Stop mode.