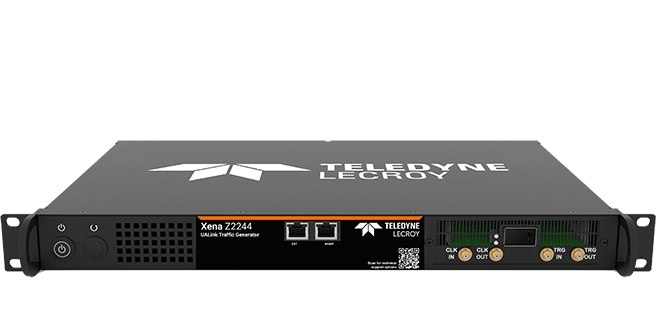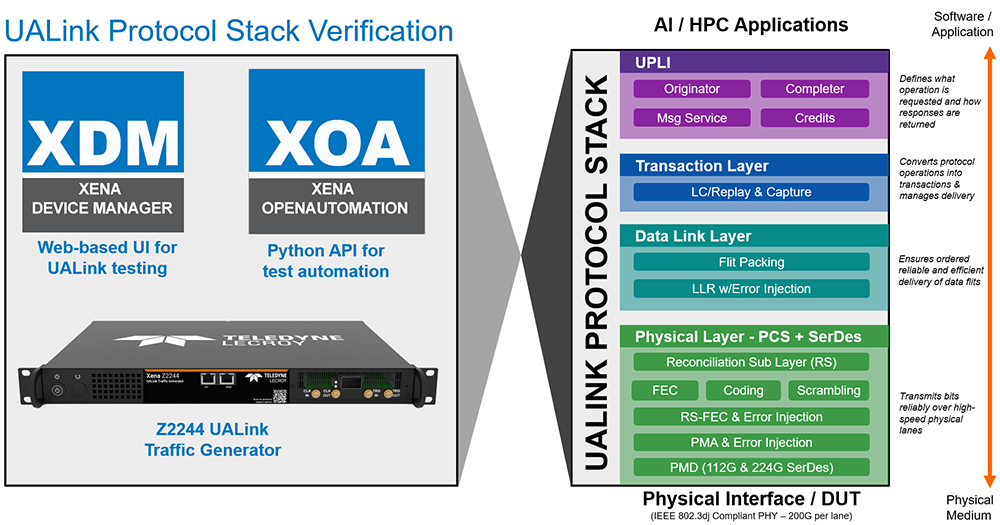
The Xena Z2244 can be controlled through an intuitive web-based UI or the XOA Python API and supports the
full UALink protocol stack. Access to all protocol layers provides complete visibility into UALink traffic and
enables the injection of impairments for comprehensive testing, validation, and troubleshooting
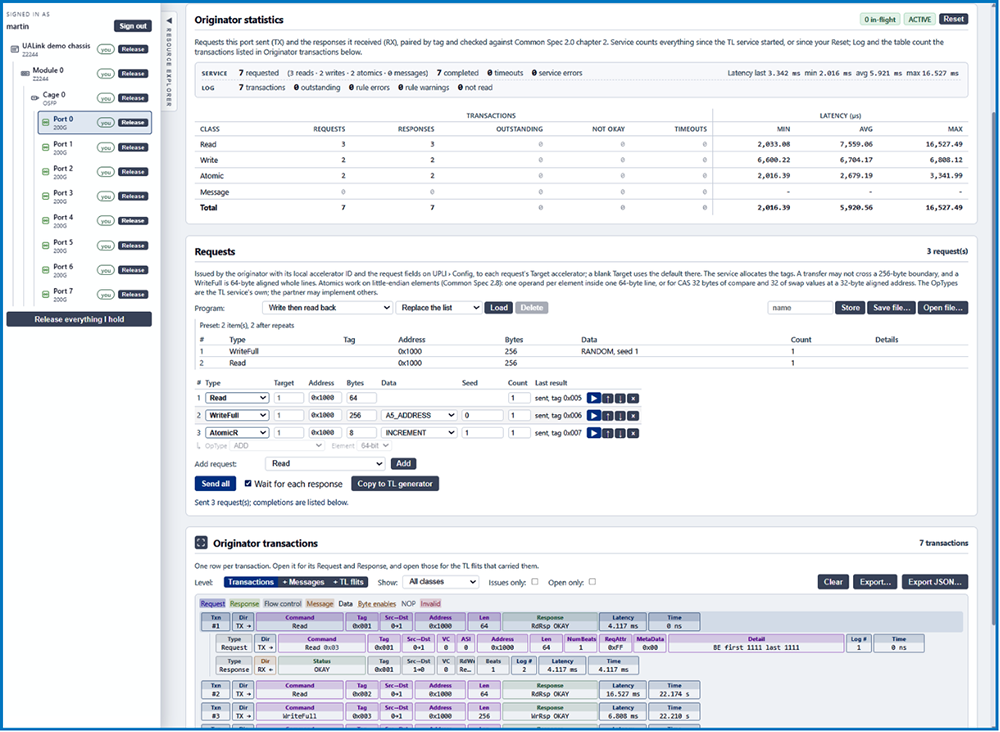
Powerful UALink UPLI Originator with support for programmable, stateful operations, comprehensive
statistics, and a detailed overview of Originator transaction communication.
Resource Explorer provides an overview for easy management of hardware port resources.
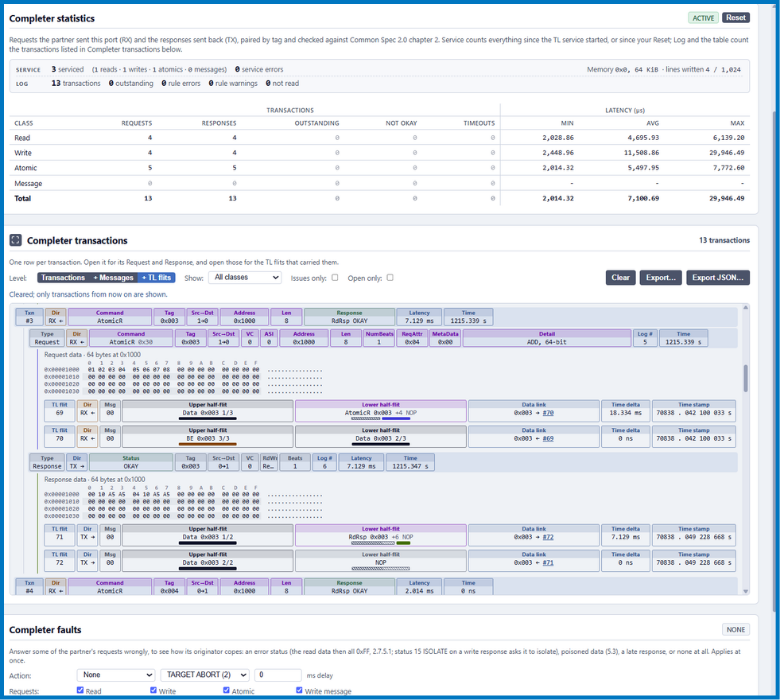
Powerful UALink UPLI Completer provides
comprehensive statistics and detailed
transaction-level visibility for analyzing
requests, responses, latency, and protocol
behavior. Programmable fault injection
enables controlled error scenarios to validate
UALink endpoint behavior, error handling,
and recovery mechanisms, helping engineers
efficiently identify issues and troubleshoot
UPLI communication
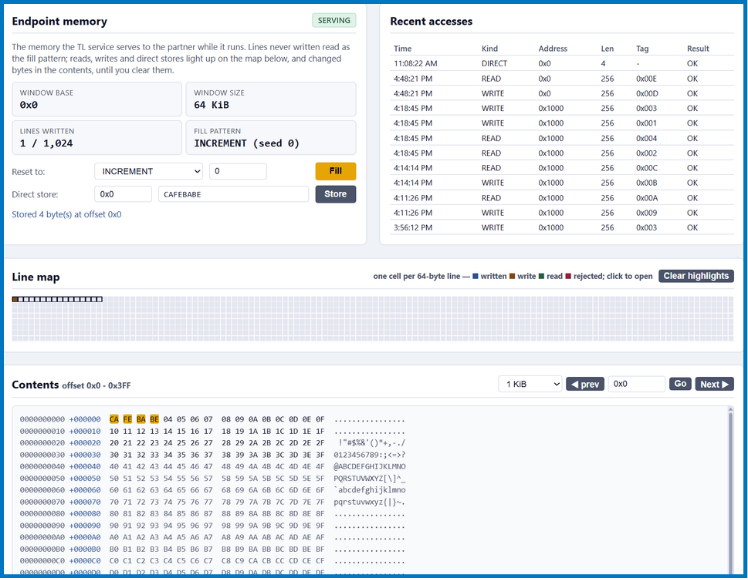
UALink Transaction Layer Service & Memory
Access Dashboard provides comprehensive
validation of UALink Transaction Layer
operations, including credit initialization, memory
read/write transactions, protocol handshaking,
and latency analysis. The dashboard enables
engineers to exercise memory access workflows,
monitor credit exchanges, track transaction
completion, and inspect live protocol traffic in real
time, accelerating debug, interoperability testing,
and performance characterization of UALink
devices.
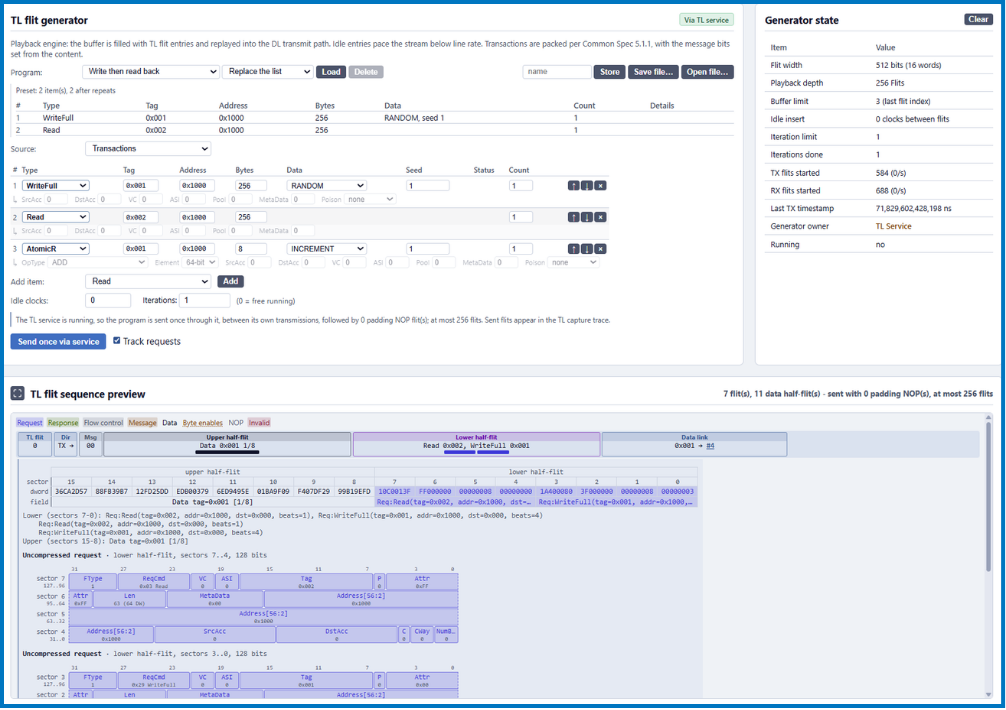
Powerful TL Flit Generator
enables programmable
generation and replay of
UALink TL flit sequences for
detailed protocol testing and
validation. Users can
configure transaction
sequences, data patterns,
timing, and iterations, while a
detailed flit-level preview
provides visibility into fields
and encoded content before
transmission. This enables
controlled testing of UALink
traffic and detailed analysis
of protocol behavior.
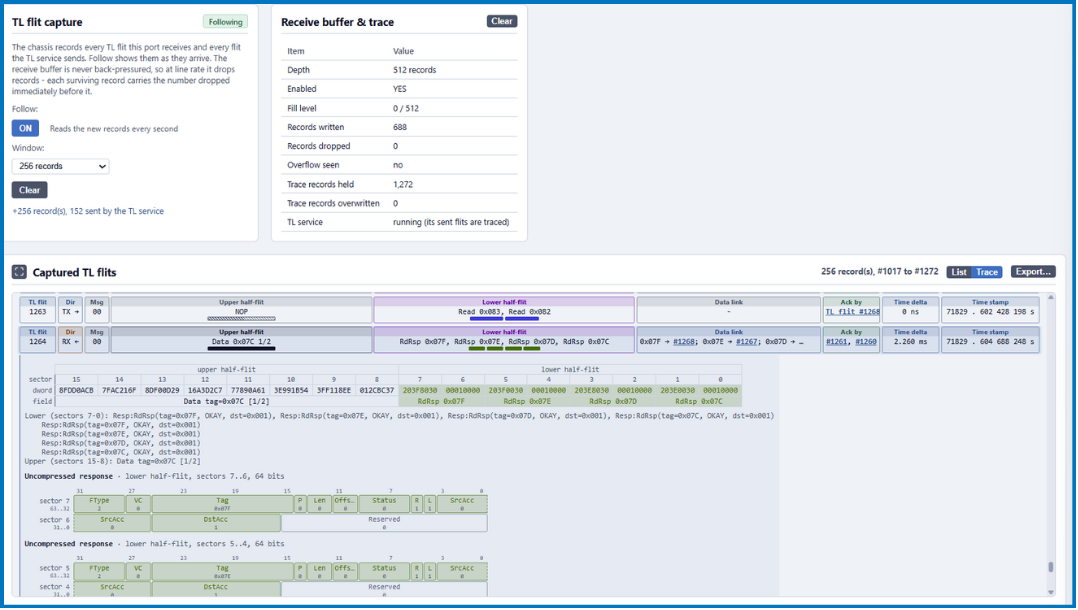
UALink TL Flit Capture
provides detailed visibility
into transmitted and received
TL traffic for protocol analysis
and troubleshooting.
Captured flits are displayed
with direction, timing,
acknowledgements, data-link
relationships, and decoded
upper and lower half-flit
contents. Detailed field-level
decoding enables engineers
to inspect individual protocol
fields and easily trace UALink
transactions for validation
and debugging.
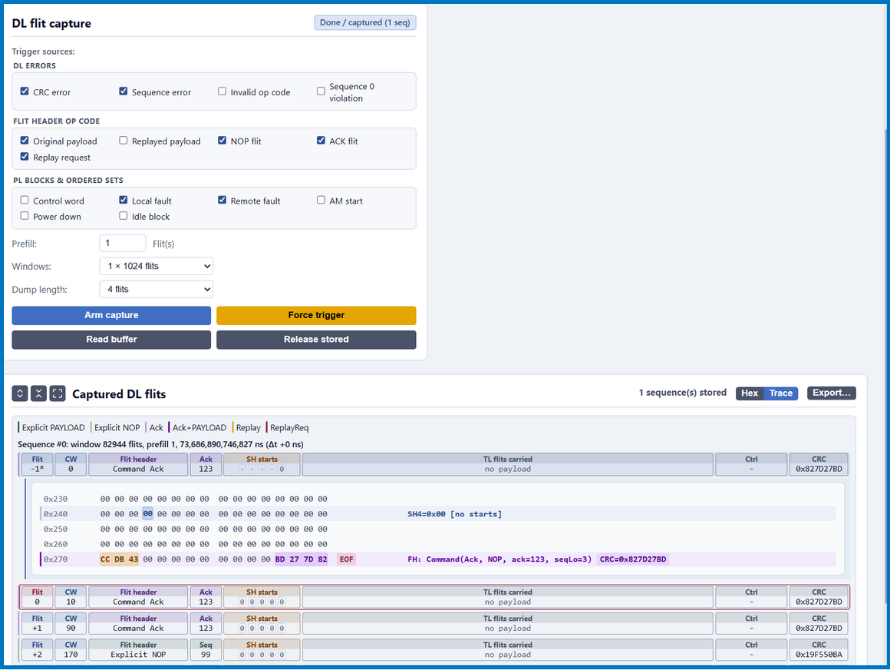
UALink DL Flit Capture provides
detailed capture and analysis of Data
Link traffic with configurable triggering
on DL errors, flit types, and Physical
Layer events. Flexible pre-trigger and
capture-window settings make it easy
to isolate specific protocol events, while
detailed decoding of flit headers,
payloads, acknowledgements,
sequence information, and CRC
enables efficient analysis and
troubleshooting of UALink link behavior.
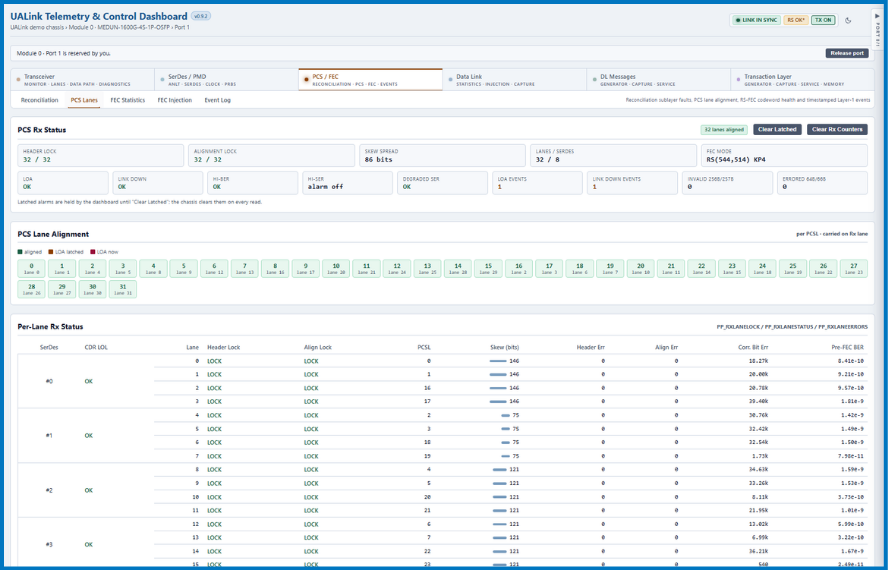
UALink PCS Lane Alignment & FEC
Monitoring Dashboard provides
comprehensive visibility into PCS lane
alignment, reconciliation status, and
RS-FEC health across high-speed
UALink interfaces. The dashboard
enables real-time monitoring of header
lock, alignment lock, lane mapping,
skew distribution, bit error statistics,
and pre-FEC BER, helping engineers
rapidly validate link integrity,
troubleshoot interoperability issues,
and optimize UALink system
performance.