Key Features
- Supports both CAN and CAN FD
- Symbolic trigger setup, decode, and data extraction and graph setup using (customer-supplied) DBC file (TDME Symbolic option only)
- Error-frame red color decode highlight
- DATA trigger pattern setup can be less than full bytes/nibbles and can be spread across bytes
- Conditional DATA trigger definition (<, <=, =, >, >=, <>, IN RANGE, OUT of RANGE)
- Conditional ID trigger definition (<, <=, =, >, >=, <>, IN RANGE, OUT of RANGE)
- Supports 29-bit GM CAN Priority ID, Source ID, Parameter ID trigger and decode
- Intuitive, color-coded decode overlays
- Interactive protocol table with zoom and pattern search
- Automated timing measurements (TDME option only)
- Serial digital data extraction to an analog value (serial DAC) with waveform graphs (TDME option only)
- Eye Diagrams with failure location (TDME option only)
Conditional DATA Trigger Setup ("T")
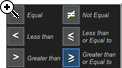
The trigger permits a conditional (<. <=, =, >, >=, <>, inside a range, outside a range) setup for the DATA condition. This is especially useful in situations where abnormal events should be monitored, such as when a CAN node broadcasts a low or high engine RPM or coolant pressure.
Trigger Flexibly Across Data Bytes ("T")
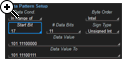
CAN remains the most used vehicle serial data bus. Many vehicle bus software architectures are very message dense, and data for a single message is spread across multiple data bytes. The hexadecimal and measurement toolsets permit isolation of specific bit-level data patterns in one or more data bytes, e.g., data location in bits 17-28 in data bytes 3, 4, and 5. This provides significant advantages in isolating the exact information or behavior you need. Symbolic message/signal setup is even simpler.
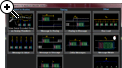
Intuitive, Color-coded Decode Overlays ("D")
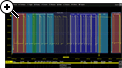
A transparent overlay with color-coding for specific portions of each protocol and the entire message frame makes it easy to understand your serial data information. Unlike other solutions, with protocol decode information away from the signal, our solution correlates the waveform and the protocol decode directly on the display. As the acquisition length is expanded or shortened, the decode overlay will adjust to show you just the right amount of information.
Symbolic Trigger, Decoding and Measure/Graph ("Symbolic")
CAN Symbolic options support use of a customer-supplied DBC file for signal selection for triggering and CAN to Value serial data DAC setup. Additionally, the decode annotation is in Symbolic format as well, with complete message and signal structures described.
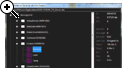
Interactive Table Summarizes Results ("D")

Turn the oscilloscope into a protocol analyzer with a tabular display of decoded information. Customize the table to show only the data of interest and touch a message in the table to automatically zoom to it and display it on the screen. Export the table for offline analysis. Up to four different decoded signals of any type may be simultaneously displayed in the table.
Measure/Graph Tools for Validation Efficiency ("M")
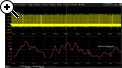
Quickly validate cause and effect with automated timing measurements to or from an analog signal or another serial message. Make multiple measurements in a single long acquisition to quickly acquire statistics during corner-case testing. Serial (digital) data can be extracted to an analog value and graphed to monitor system performance over time, as if it was probed directly. Complete validation faster and gain better insight.
Eye Diagrams ("E")
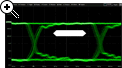
Rapidly display an eye diagram of your packetized low-speed serial data signal without additional setup time. Use eye parameters to quantify system performance and apply a standard or custom mask to identify anomalies. Mask failures can be indicated and can force the scope into Stop mode.