Key Features
-
High-performance triggering for key protocol elements such as IDs, data fields, symbols, and error conditions
-
Intuitive, color-coded decode overlays for clear signal interpretation
-
Interactive protocol tables with zoom and advanced pattern search capabilities
-
Automated timing measurements for faster validation and analysis
-
Conditional trigger definitions for IDs and data fields using relational operators and ranges
-
Support for error-frame detection and highlighting for quick fault identification
Conditional DATA Trigger Setup ("T")
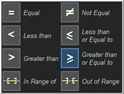
The trigger permits a conditional (<. <=, =, >, >=, <>, inside a range, outside a range) setup for
the DATA condition. This is especially useful in situations where abnormal events should be monitored, such as when
a node broadcasts a low or high engine RPM or coolant pressure.
Trigger Flexibly Across Data Bytes ("T")
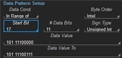
Many vehicle bus software architectures are very message dense, and data for a single message is spread across
multiple data bytes. Our LIN trigger and measurement toolsets permit isolation of specific bit-level data patterns
in one or more data bytes, e.g., data location in bits 18-26 in data bytes 2 and 3. This provides significant
advantages in isolating the exact information or behavior you need.
Intuitive, Color-coded Decode Overlays ("D")
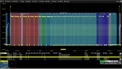
A transparent overlay with color-coding for specific portions of each protocol and the entire message frame makes it
easy to understand your serial data information. Unlike other solutions, with protocol decode information away from
the signal, our solution correlates the waveform and the protocol decode directly on the display. As the acquisition
length is expanded or shortened, the decode overlay will adjust to show you just the right amount of information.
Interactive Table Summarizes Results ("D")
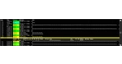
Turn the oscilloscope into a protocol analyzer with a tabular display of decoded information. Customize the table to
show only the data of interest and touch a message in the table to automatically zoom to it and display it on the
screen. Export the table for offline analysis. Up to four different decoded signals of any type may be
simultaneously displayed in the table.