Radar Signal Analysis With Oscilloscope Demodulation
Learn how oscilloscope demodulation and FFTs reveal radar pulse envelopes, Barker-coded phase modulation, chirp behavior, and frequency content.
Learn how oscilloscope demodulation and FFTs reveal radar pulse envelopes, Barker-coded phase modulation, chirp behavior, and frequency content.

This article explains the expected behavior of on-die power rails during CMOS switching events, including PDN current flow, clock-edge noise, and asymmetric current draw between switching and latching operations.

Learn how oscilloscope histograms help characterize component specifications by comparing propagation delay, mean, standard deviation, and measurement spread under different conditions.

This article explains how the oscilloscope Track function can be used for anomaly detection and waveform demodulation by graphing synchronized measurement values directly against the input waveform.

Modern oscilloscopes contain many tools that can be used for analyzing data, including Track and Trend math functions. Both Tracks and Trends graphically display measurement results and locate anomalies. The main similarity between Tracks and Trends is that the Y-axis of both operators is the measurement parameter itself (for example, Pulse Width, Duty Cycle, Rise Time, Slew Rate, etc.). The main difference between the two math operators is their X-axis, in which the Track uses the identical X-axis and synchronous horizontal scaling as the input waveform, whereas the Trend uses units of chronology. A Track, in essence, is a waveform of the measurement values. A Trend is a data logger showing the history of change in measured parameter values, but points are not necessarily synchronous with the measured waveform.
The Track provides valuable debugging information by directly pointing to an area of interest.
Notice the negative-going spike in the Track waveform in Figure 1 (above). Figure 1 occurs at the point in time where the input waveform reaches its most narrow pulse width, and the Track instantly finds it, indicating when one measurement deviates from the others in the graph. The Track identifies the exact location in time where the narrowest or widest pulse width has occurred, and fully describes the measurement changes occurring throughout the entire waveform. Since oscilloscopes can acquire thousands or even millions of waveform edges within a single acquisition, the Track allows an engineer to quickly "find the needle in a haystack".
In addition to locating anomalies, Tracks can synchronously demodulate a waveform, which is useful for uncovering repeating characteristics within signals. When a repeating pattern occurs, the pattern is often not visible to the user because changes in the waveform are quite subtle relative to the repetition time. Consider the case of the same repeating pulse width modulation pattern.
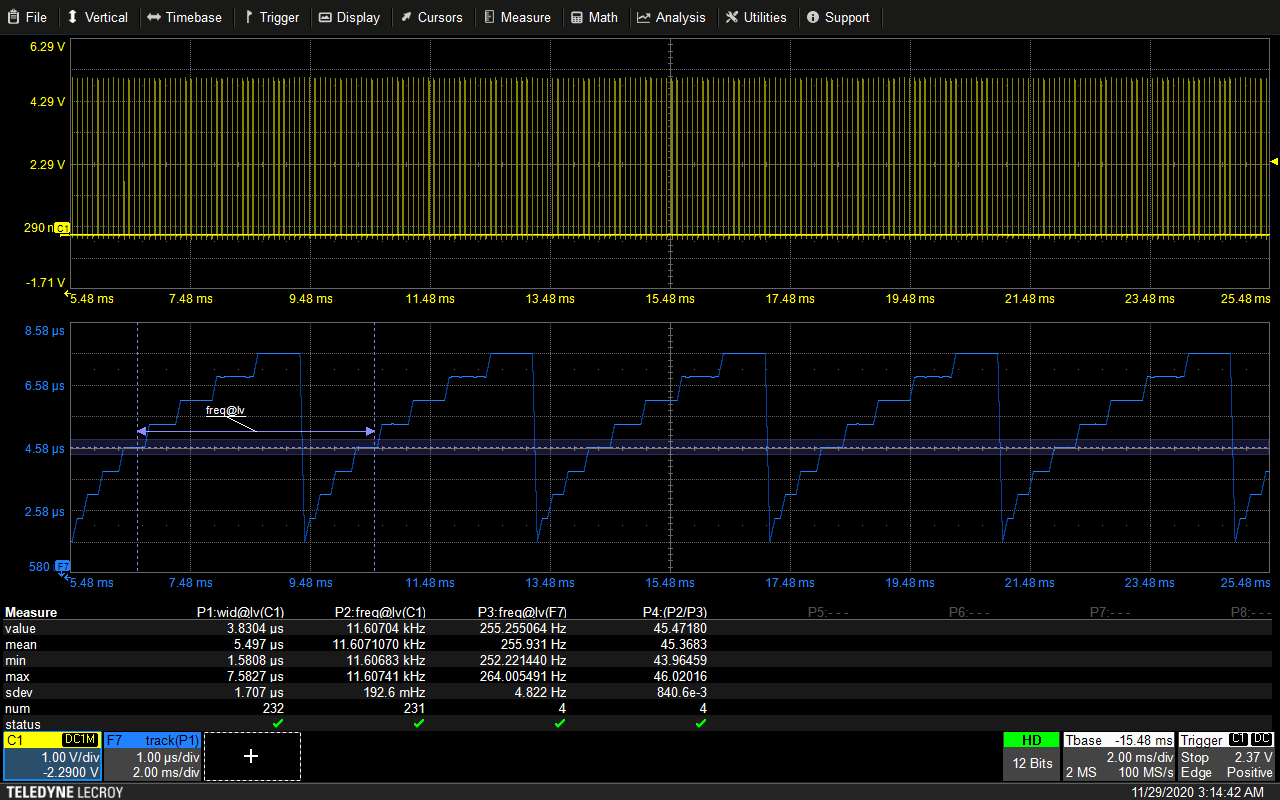
Shown in Figure 2, the Track operator has demodulated a PWM waveform using a much longer time interval. The shape of the pulse width modulation reveals a repeating modulation pattern which would not have been obvious to an engineer if not for the shape of the Track, because at the time scale needed to capture several repetitions of the PWM pattern, there are at least hundreds of pulse widths on the screen. This allows for the user to identify which underlying data patterns exist within the data and their rate of occurrence.
In order to determine how many pulse widths comprise one full repetition of a PWM pattern, the user can measure the frequency of the input waveform and the frequency of the pattern itself, and calculate the ratio of the two frequencies, as shown in Figure 2. By graphing primary measurements, then demodulating the pulse train with the Track operator, secondary measurements on the Track provide a complete description of the underlying pulse width modulation scheme. This type of application is where the Track math operator is at its best, allowing an engineer to combine math and measurement operators in a simple way to learn a great deal about a circuit's behavior.
Copyright © 2020-2026 Teledyne LeCroy. All rights reserved. All original content, including text and photos, is the property of Teledyne LeCroy and cannot be reproduced without expressed written permission.

Learn how oscilloscope histograms help characterize component specifications by comparing propagation delay, mean, standard deviation, and measurement spread under different conditions.

Learn how oscilloscope histograms visualize measurement variation, identify distribution shapes, and quantify rare events in waveform timing and amplitude data.

This article explains how the oscilloscope Trend function differs from Track, and how it can be used for long-term measurement analysis, data logging, and monitoring evolving signal behavior across multiple acquisitions.

This article explains how oscilloscope Track functions can demodulate frequency- and phase-modulated RF signals by graphing instantaneous Frequency and TIE measurements over time.