Radar Signal Analysis With Oscilloscope Demodulation
Learn how oscilloscope demodulation and FFTs reveal radar pulse envelopes, Barker-coded phase modulation, chirp behavior, and frequency content.
Learn how oscilloscope demodulation and FFTs reveal radar pulse envelopes, Barker-coded phase modulation, chirp behavior, and frequency content.

This article explains the expected behavior of on-die power rails during CMOS switching events, including PDN current flow, clock-edge noise, and asymmetric current draw between switching and latching operations.

Learn how oscilloscope histograms help characterize component specifications by comparing propagation delay, mean, standard deviation, and measurement spread under different conditions.

Learn how oscilloscope histograms visualize measurement variation, identify distribution shapes, and quantify rare events in waveform timing and amplitude data.

When we measure parameters of a waveform in a circuit or device, we rarely take a single measurement but rather a significant number of measurements. We want to see trends over time in the period, width, and time-interval error of a clock pulse, for example. Those parameters will have some nominal value, but there will typically be some random variation that we refer to as jitter.
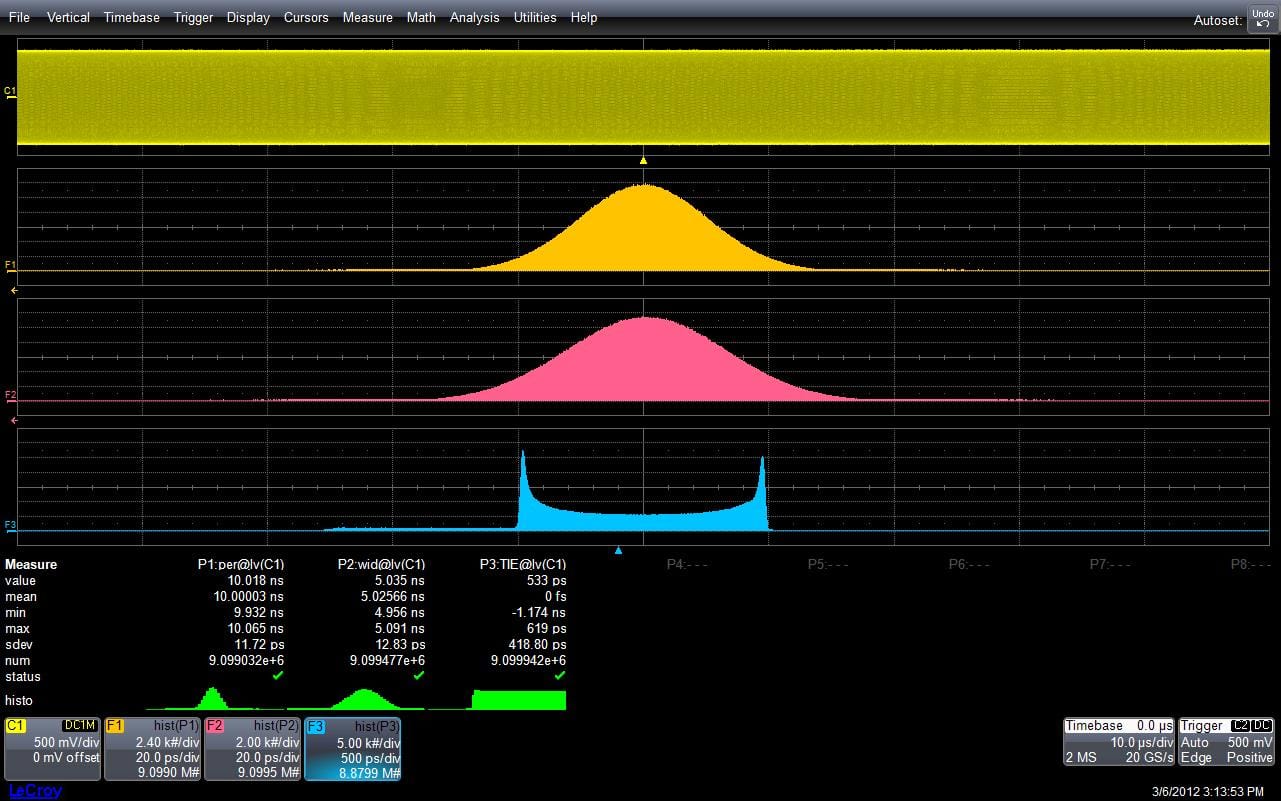
Statistical analysis gives us a window to the view we want of this random variation in our DUT's behavior. A particularly handy tool in this vein is histograms, which many oscilloscopes (including most Teledyne LeCroy models) can generate as a means of visualizing and quantifying random processes (Figure 1). The histogram display shows the shape of the distribution of parameter values. Associated statistical parameters provide accurate, yet concise, measurements of that distribution. From this data, we can learn quite a bit about our signal.
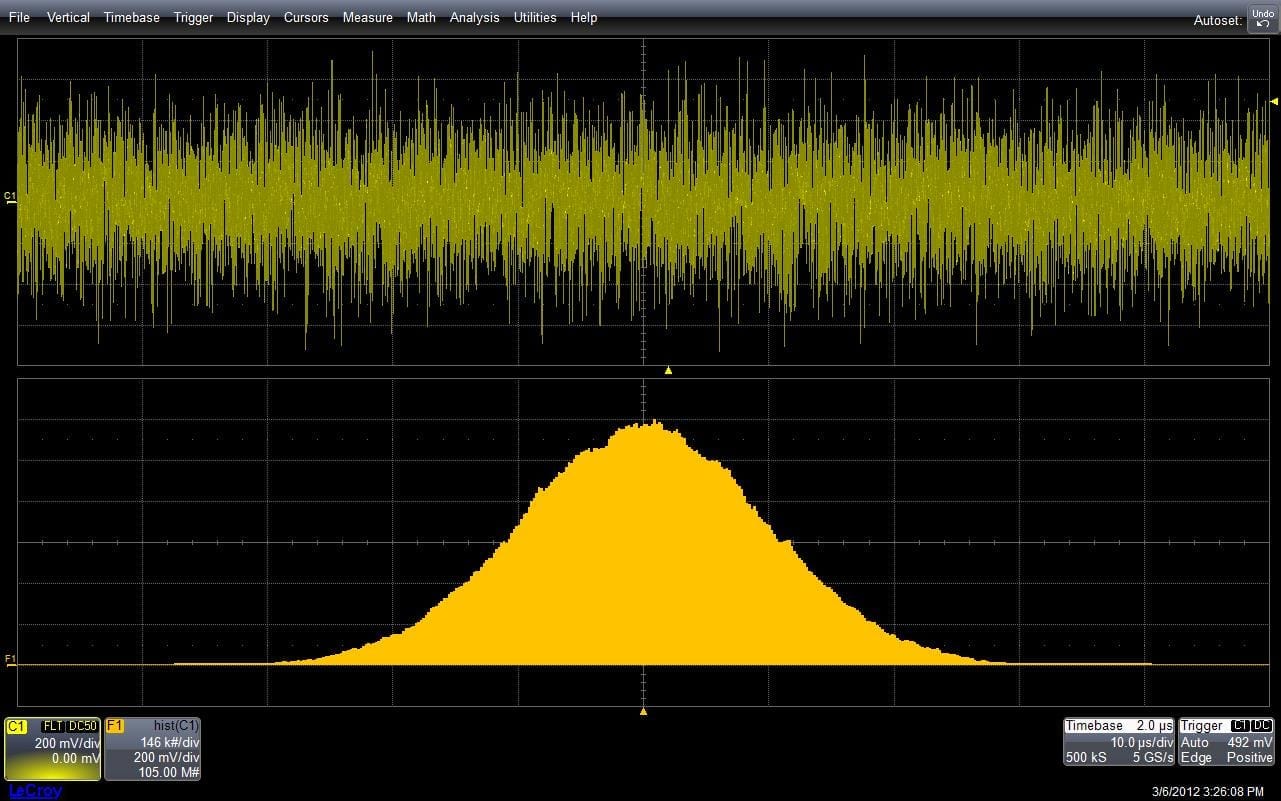
The distribution of measurement values shown in a histogram is related to the underlying process that generates the distribution. In Figure 2, we see an example of a random process that produces a Gaussian (or normal) distribution of amplitude values. The Gaussian distribution is a good indication that a random process is shaping variations in the measurement.
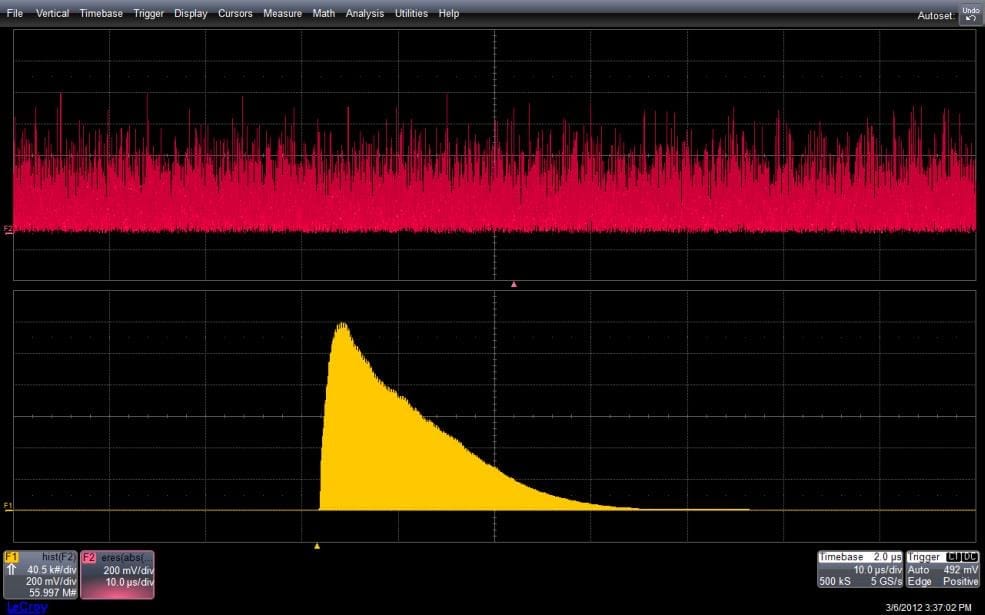
Now consider what happens when a Gaussian-distributed noise signal is applied to an envelope detector (Figure 3). In this case, the process involves full-wave rectification (an absolute-value function) and filtering (simulated in the oscilloscope using waveform math). Here, the distribution of amplitude values changes to a Rayleigh distribution. The amplitude values are no longer symmetric about the mean value (the effect of rectification). Knowledge of these effects allows us to calculate the expected noise power related to the input noise levels. Conversely, if the process was unknown, the measurement of the input and output distributions would help identify the operating process.
In Figure 4, the uniform distribution of delay is a characteristic of normal
operation in a timing synchronizer. This circuit synchronizes a random trigger event with a 400-MHz clock (2.5-ns period). If the input signal is independent of the system clock, then there is an equal probability of having any value of delay between the input and output over the range of one clock period.
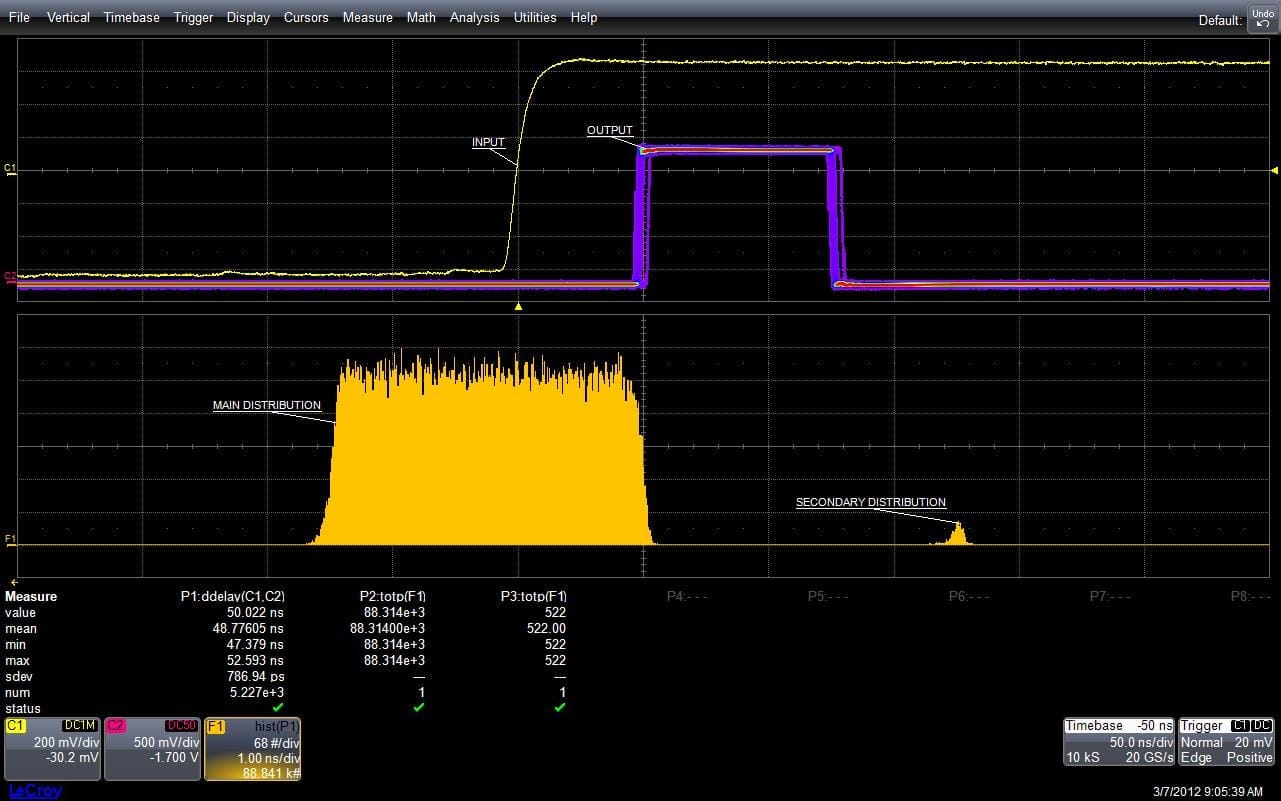
In this example, note that the main distribution of the measured delay varies uniformly over a range of 2.5 ns as expected. However, a longer delay occasionally occurs, which shows up in the persistence display on Ch2 and as the secondary distribution in the histogram. By comparing the total populations of each section of the histogram, we find that the delayed event occurs 0.6% of the time. This highlights an advantage of the statistical study of measured data in that it quantifies rarely occurring events that might otherwise be overlooked.
Copyright © 2020-2026 Teledyne LeCroy. All rights reserved. All original content, including text and photos, is the property of Teledyne LeCroy and cannot be reproduced without expressed written permission.
Steve Murphy presented a webinar How to Use Statistical Data and Histograms in Your Oscilloscope. This webinar was Part 6 of the 2022 Oscilloscope Coffee Break Webinar Series. Click the button below to watch this webinar or any other webinar in that series, or download the transcript to preview the webinar content.

Learn how oscilloscope histograms help characterize component specifications by comparing propagation delay, mean, standard deviation, and measurement spread under different conditions.

This article explains how the oscilloscope Trend function differs from Track, and how it can be used for long-term measurement analysis, data logging, and monitoring evolving signal behavior across multiple acquisitions.

This article explains how the oscilloscope Track function can be used for anomaly detection and waveform demodulation by graphing synchronized measurement values directly against the input waveform.

This article explains how oscilloscope Track functions can demodulate frequency- and phase-modulated RF signals by graphing instantaneous Frequency and TIE measurements over time.